Today Occidental's 1 MW solar array is 6 years old. Since "first-light" on March 4th, 2013 the array has produced 11.01 GWh of electrical energy, 12.0% of the college's use over the same time period.
Good Morning Occidental!
Today Occidental's 1 MW solar array is 6 years old. Since "first-light" on March 4th, 2013 the array has produced 11.01 GWh of electrical energy, 12.0% of the college's use over the same time period. For equivalencies, especially regarding climate change, you can punch in 11.01 GWh = 11010000 kWh here.
In the last year the array produced 1.83 GWh of electrical energy. For comparison here are the numbers from previous years,
1st year = 1.82 GWh
2nd year = 1.88 GWh
3rd year = 1.79 GWh
4th year = 1.82 GWh
5th year = 1.87 GWh
6th year = 1.83 GWh
The industry-wide expectation is that a solar array will lose about 0.5% of its production every year. So by now I expected our production to be down by 3%. It’s tough to tell from the numbers above because they are affected by lots of yearly systematics such as cloud cover, temperature, inverter failures, rain, dust, weeds, cleaning and weeding. In preparation for a URC talk I gave last summer I downloaded NREL solar irradiance data, temperature data from our solar array monitoring system (username = oxysolar, password = 1600solar on Chrome, Firefox, IE or Opera, no Safari) and inverter failures from the solar array log book for past years and used it, and a model for our solar array, to come up with a theoretical prediction for what the solar array should have been producing every day. The results are shown below:
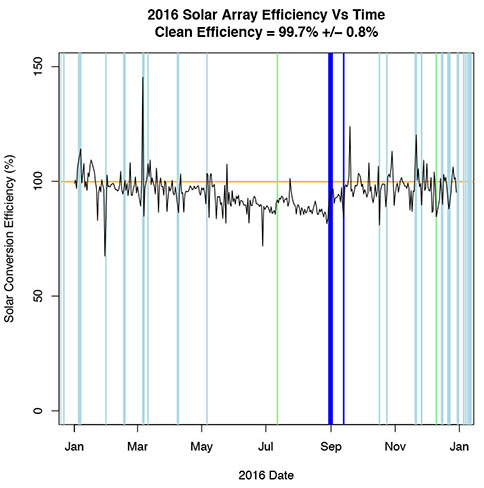
The vertical axis is the ratio of actual production to expected production while the horizontal axis is the 2016 calendar year date. Vertical light blue lines show days when the college received 0.1 inches of rain or more, vertical dark blue lines show days when the array was cleaned and vertical light green lines show days when the array was weeded. The squiggly, black line shows the ratio of what the array actually produced to what it should have produced controlling for clouds, temperature and inverter failures (there were none in 2016). Somewhat arbitrarily I defined the array as “clean" if it received 0.1 inches or more of rain or after it is fully cleaned. The data was provided by our weather station, of course! I calculated a clean efficiency for 2016 to be 99.7+/-0.8%. All of the yearly numbers for other years are consistent with 100% efficiency and with similar error bars so I see no evidence for a decline in performance. I recently ran across an article (see Figure 11 IBC graph) which, after analyzing hundreds of solar arrays over many years, concludes that our SunPower panels decline at a significantly reduced rate of only 0.2% per year. So maybe that’s it. Time will tell.
Now then, you will notice a big dip in performance over the summer months. That is a very consistent yearly effect and I attribute it, mostly, to dust accumulating on the panels, called soiling in the PV industry. For the URC talk I did an analysis which attempted to balance soiling losses with cleaning cost losses and came up with a rule to minimize our losses. The rule, which depends of cleaning costs, suggest we should clean the array about 1.5 times per year and facilities is now implementing that rule.
On the financial side of things, our electrical bills have been lower these last three years due to the energy generated by the solar array. Over the last year the solar array saved the college $280k. For comparison here are the numbers from previous years,
1st year = $250k
2nd year = $293k
3rd year = $233k
4th year = $248k
5th year = $278k
6th year = $280k
The grand total savings so far is $1.600M on a purchase price of $3.423M. The calculated payback period is now 16 years, 10 years from now.
I will leave you today with this important tiger-fact,

Who knew?! Go Tigers!!!