We've reached the end of the first, almost full, month of operation of the Oxy solar array so I thought I'd write to update everyone on what is going on up there and provide some context for what it all means.
Oxy community,
We've reached the end of the first, almost full, month of operation of the Oxy solar array so I thought I'd write to update everyone on what is going on up there and provide some context for what it all means. Here's what the first month looked like:
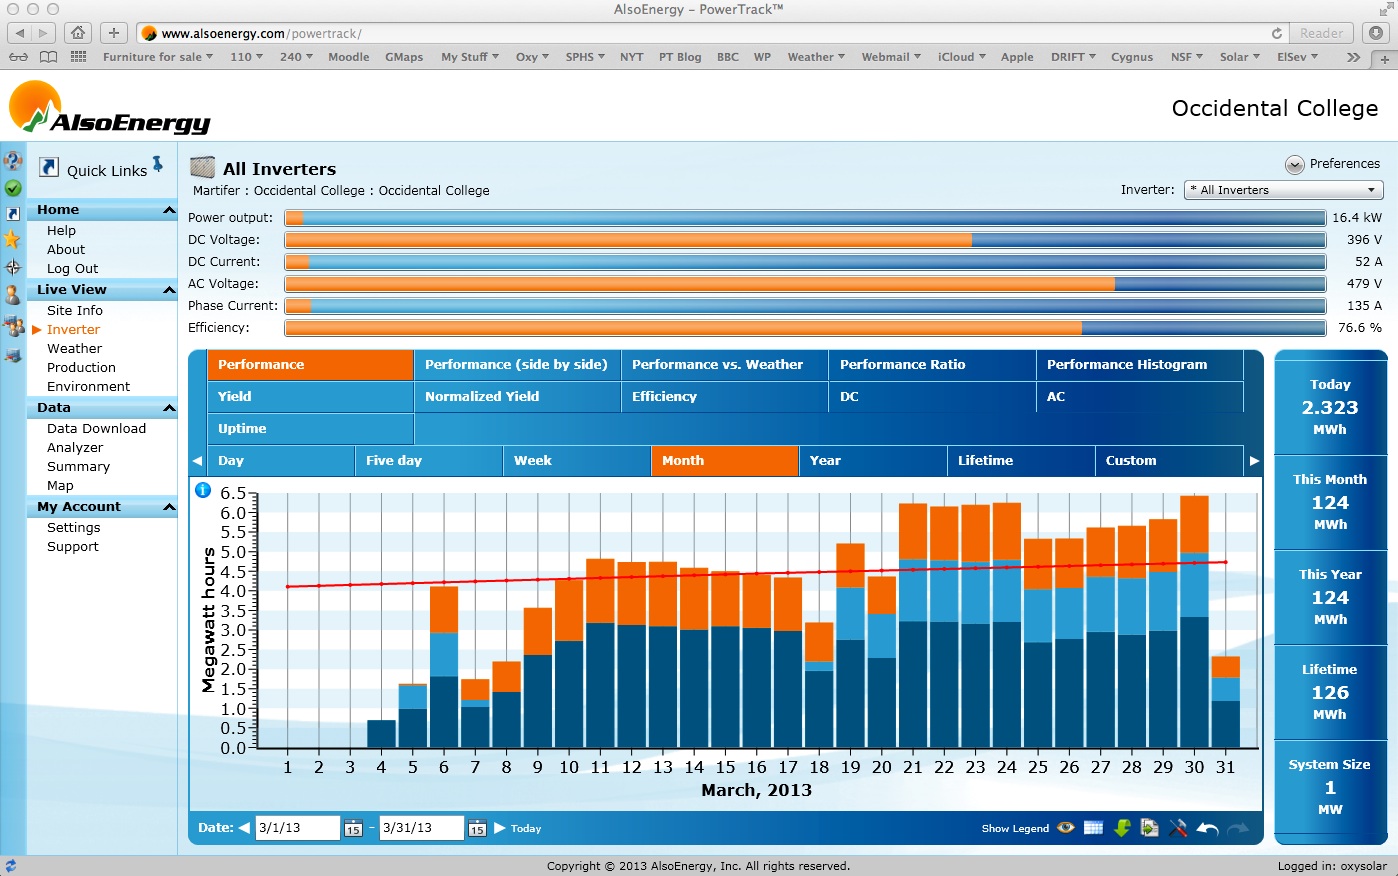
As you can see we started generating power on March 4th which, linguistically, is a good day to start something big. Unfortunately the marching didn't go too well the first few days. On March 6th we had all 3 inverters (shown in the three colors dark blue, light blue and orange) working but on the 7th the light blue one blew a fuse. That took 11 days to get fixed. Fingers crossed that it stays fixed. Since then the array has performed well. The variation in the height of the bars reflects the variation in the solar radiation on those days. The red line shows what we would expect on average.
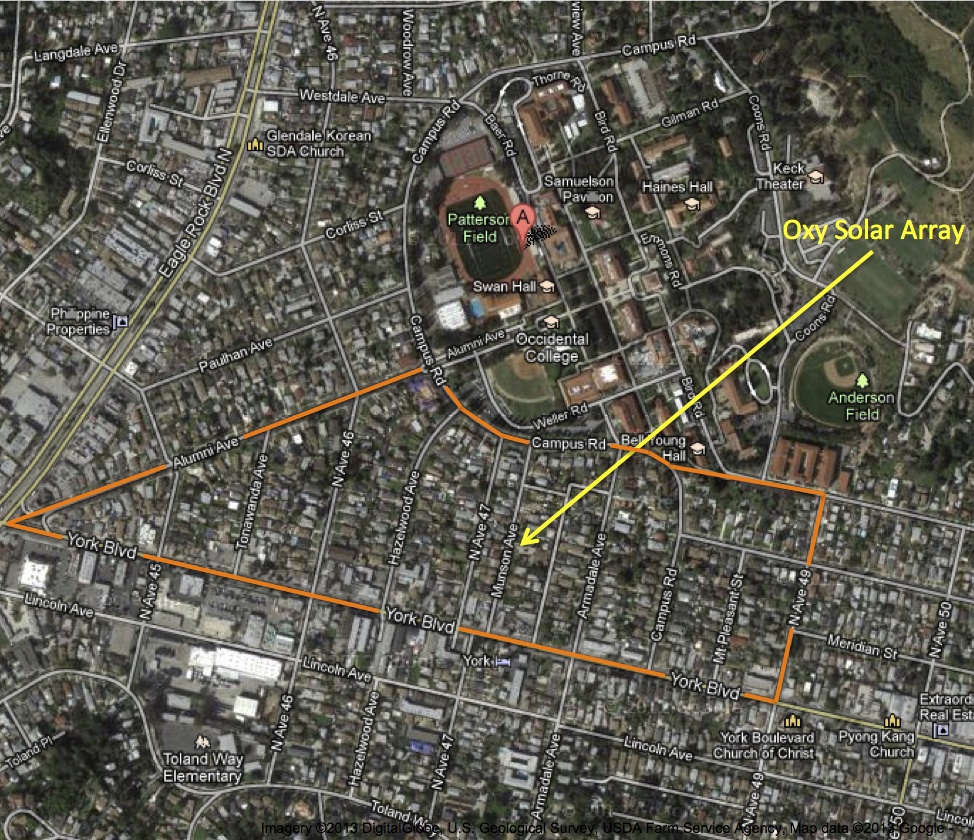
Now what do all these numbers mean? I want to first call your attention to the units. Most households measure their electrical energy usage in kWh which is 1,000x times smaller than the units natural for our array, MWh. This array generates a lot of power! On average, over the course of the year, my production model predicts that our array will generate about 4.7 MWh per day. According to this document the average LADWP household uses about 14.8 kWh per day. So on an average day we generate enough energy to supply about 318 average LADWP homes with energy. That's all the houses circled in the Google map below. (Yes I counted them). It'll be half of that in December and twice that in July.
This month we made 126 MWh whereas my solar model predicts 140 MWh. Of course we weren't operating for several days and the inverter blew a fuse so I wasn't expecting these numbers to match. I actually pleasantly surprised at how close they are. I have a feeling my solar model is a little too simplistic and perhaps conservative. Our array is pretty complicated to model! For those of you who like to keep score I'm predicting we will generate 155 MWh in April. We'll see.
If you are interested in climate change, 1 MWh translates into 0.665 metric tons of CO2 not emitted into the atmosphere, on average according to data obtained here for the LADWP, very close to the national average. So this month's generation of 126 MWh means that 84 metric tons of CO2 did not go into the atmosphere.
Taking into account that we pay different rates depending on when we make our energy the 126 MWh that we produced, or didn't use, this month translates into $12,932 saved over the last month in utility bills, a little more than $100 per MWh. Our electrical bill is very complicated and the savings are actually larger but that is a story for another day.
Once again, if you want to log in yourself you can go to,
http://www.alsoenergy.com/
Login ID = oxysolar
Password = 1600solar
Enjoy!