Today, Occidental's 1 MW solar array is 12 years old. Since "first-light," on March 4th, 2013, the array has produced 20.70 GWh of electrical energy, 11.55% of the college's usage over the same time period.
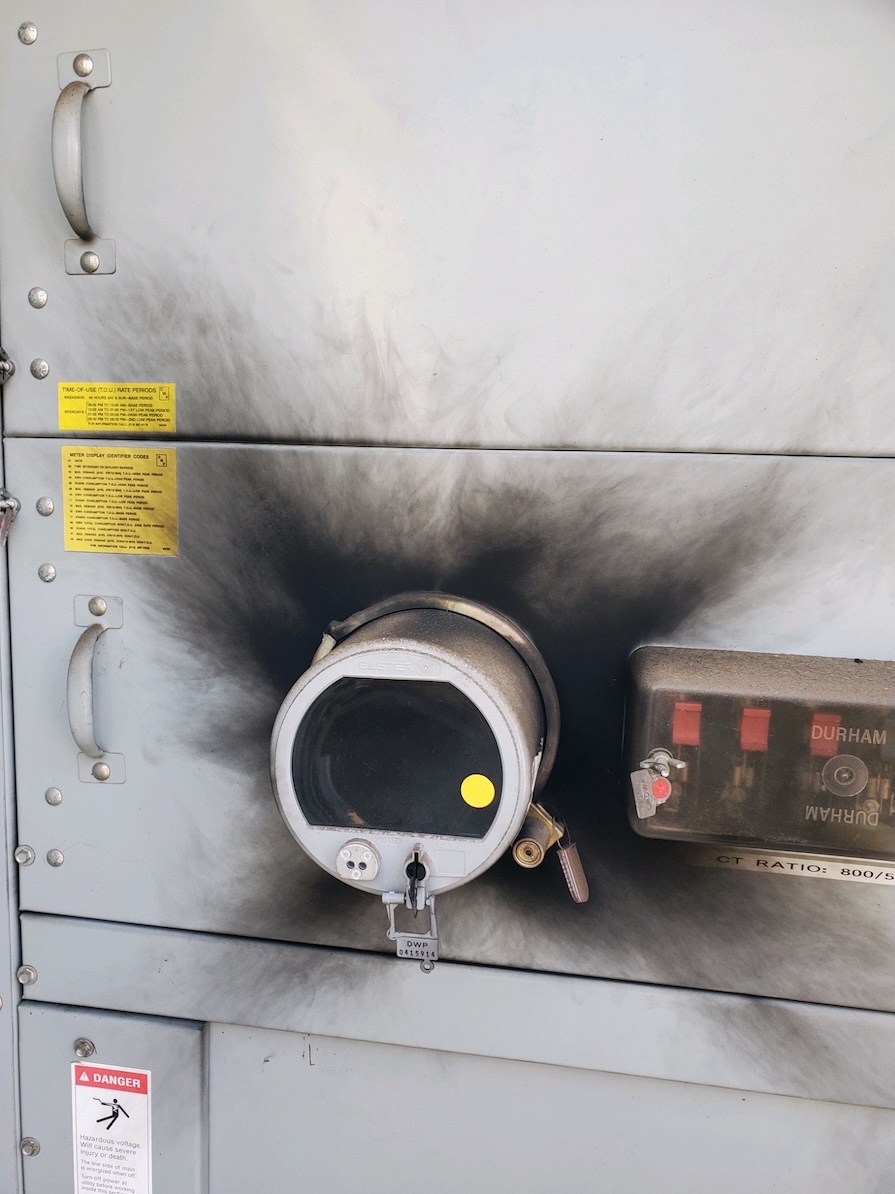
In this last year the array produced 1.30 GWh of electrical energy, about 25% below our average of 1.72 GWh. This was our lowest yearly production, second only to last year. Now last year I blamed our low production on the weather; this year not so much. The trouble started over the summer on July 12th when we lost contact with the carport inverter. A change in monitoring software meant no one was alerted about this until August 24. On September 3 (22 days later) a CSI technician came out to take a look and noticed that our LADWP meter had burned, see pic below. On September 19 (16 days later), out of caution, the entire array was disconnected from the campus until it could be fixed. Then we waited and waited and waited and sent many emails to the LADWP urging them to fix their broken meter. It wasn't until November 8 (50 days later!) that the burned out meter was replaced. CSI returned on November 12 and we then returned to normal operation. I'm not sure we can do anything about the LADWP but we have fixed up our monitoring software.
On the financial side of things, our electrical bills have been lower due to the energy generated by the solar array. Over the last year the solar array saved the college $288k, our second lowest yearly savings, second only to our first year when electricity prices were much lower. Ugh!
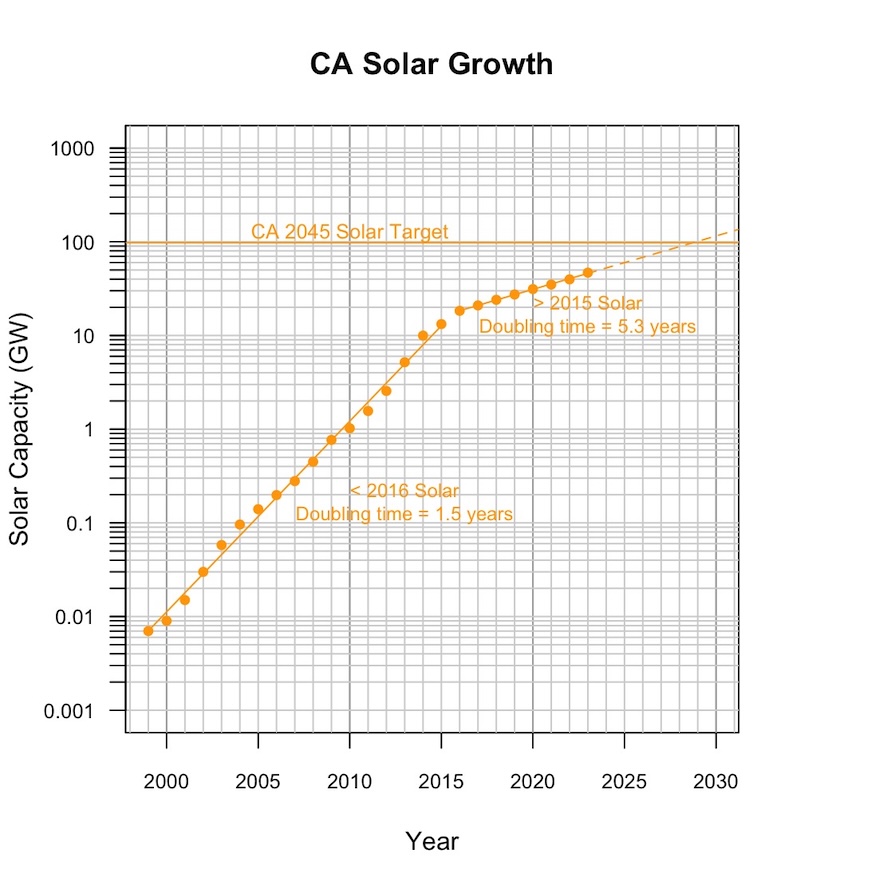
For a sunnier story let's look at what's going on in California. According to a recent summary California ranks 1st in installed solar capacity of the 50 states and currently supplies 31.4% of all of our electrical energy. A plot of California's solar generating capacity from 1999 to 2023 [1] is shown below. On the horizontal axis is the year. On the vertical axis is capacity (max power possible) in GW. This is a log-linear plot so you have to be a little careful. A straight line on this plot indicates exponential growth. What's interesting is that there is break in the exponential growth around 2015-2016. Before 2016 the doubling time was about 1.5 years (capacity doubles every 1.5 years) and after it was, and is, about 5.3 years. Despite the slowdown we are still on track (see dashed line) to hit our 2045 goal of 100% renewable energy by around 2029, 16 years early, so that is good news.
I'm not sure what happened around 2016 but surely a contributing factor was that around then we were producing so much solar energy we were having to ship the excess off to other states and pay them to take it! The problem occurs only mid-day when the panels are cranking [2]. The solution is to store some of that energy in batteries and shift it to later in the day. And that is what California is doing.
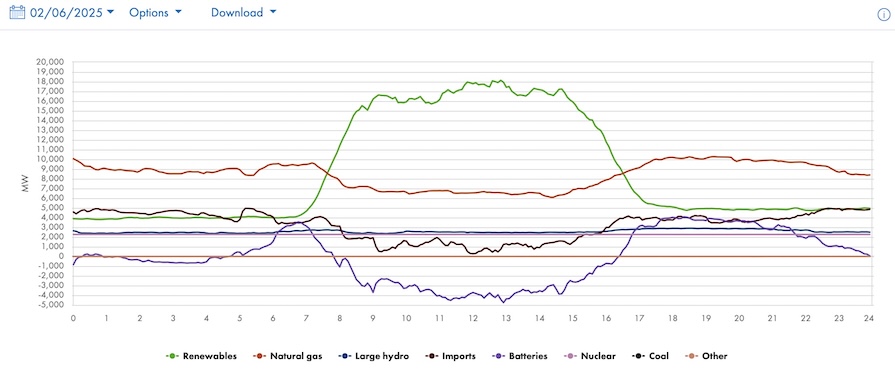
This plot [3] shows solar plus wind production (in green) for Feb. 6, 2025, as an example. The purple curve is for California's battery fleet. From about 7:45 AM to 4:15 PM the battery power was negative, indicating the batteries were charging. Then in the evening that energy was given back to the grid. The main thing is that the amount of energy being stored in these batteries, the area “under the curve", is a significant fraction of the renewable energy being generated which is a significant fraction of California's energy usage.
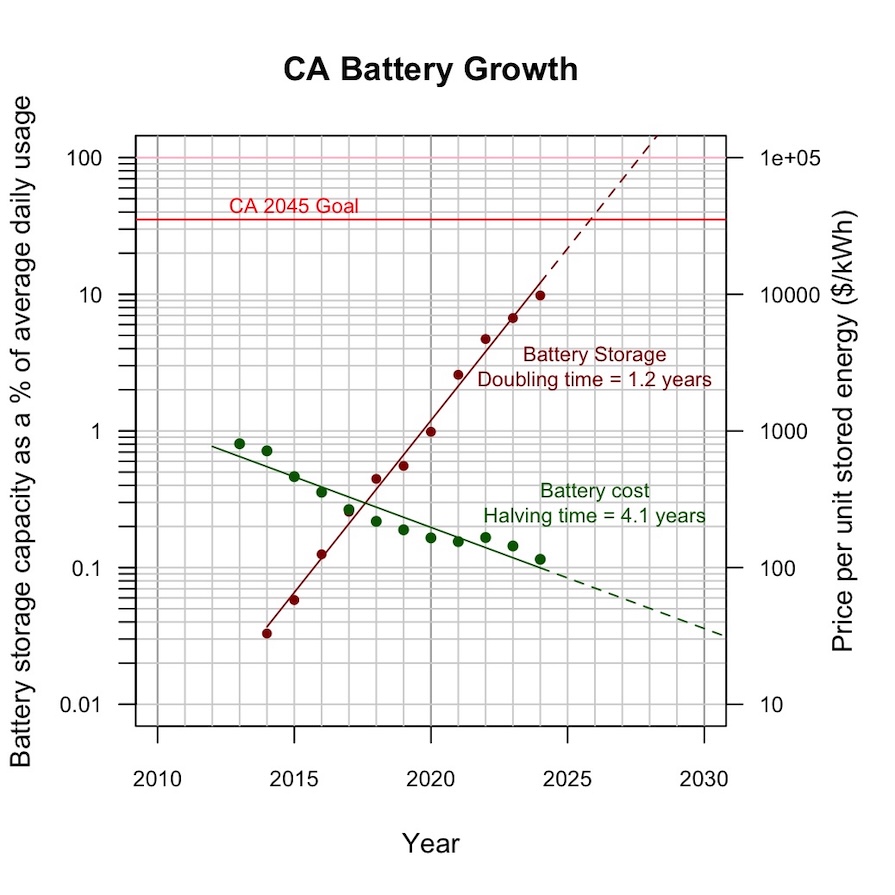
So what is that fraction and how fast is it growing? The plot [4] below shows my quick and crude answer.
The dark red dots show the ratio between the amount of energy that can be stored in California's batteries and the average daily electrical energy usage by California. Last year that ratio was 10%, as shown on the left axis. I calculate that the 2045 goal is roughly 35%, so we have a ways to go. Or do we? Looking at the rest of the red dots on this log-linear plot we find a doubling time of 1.2 years. That's amazing! And it suggests we will reach our 2045 goal in about 2 years, 19 years ahead of schedule. This growth is being driven by rapidly falling battery costs [5] as shown with the green dots and using the right vertical axis.
I hope you have a chance to get some sun today and recharge your batteries.
[1] From the WikiPedia.
[2] We are not the only ones having this kind of trouble. Germany has been experiencing similar issues for years. They just introduced a new law to deal with this called the Solarspitzen, my new favorite word!
[3] Data from the California Independent System Operator (CAISO).
[4] Data from the California Energy Commission.
[5] Data from Statista.


