Today, Occidental's 1 MW solar array is 3 years old. In the last year the array produced 1.78 GWh of electrical energy, slightly down from our first (1.82 GWh) and second (1.88 GWh) years.
Good Morning Occidental!
Today, Occidental's 1 MW solar array is 3 years old.
In the last year the array produced 1.78 GWh of electrical energy, slightly down from our first (1.82 GWh) and second (1.88 GWh) years. The decrease was due to the Mother's Day Balloon Incident (MDBI) which took out our large inverter in May. Altogether the array has produced 5.48 GWh of electrical energy. That is a LOT of energy. We could have powered 338 of our neighbor's houses for 3 years with that energy. For other equivalencies, especially regarding climate change, you can punch in 5.50 GWh = 5480000 kWh here.
Here is the college's energy use over the past 18 years, by calendar year. The dashed line represents where we would have been without the solar array.
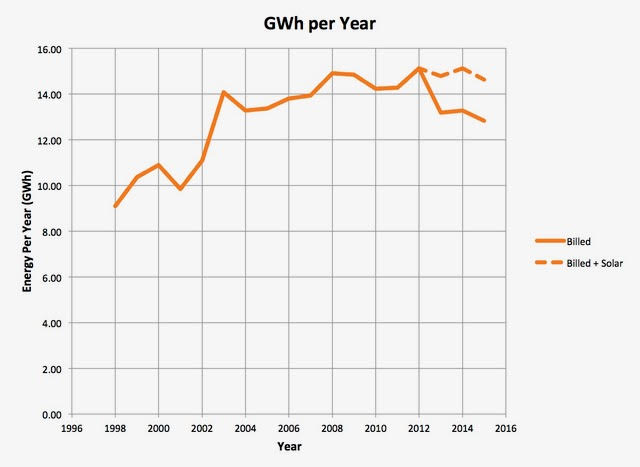
On the financial side of things, our electrical bills have been lower these last three years due to the energy generated by the solar array. Over the last year the solar array saved the college $234k, down from the first ($250k) and second ($293k) year savings. This was due to loss of energy generation for May and the repair costs incurred by the MDBI. All told, though, we have saved a cool $776k on a purchase price of $3.423M. We are 20% of the way to paying off the array [1]. At an assumed 6.3% annual rate increase [2] we will have paid off the array in 17 years. Last year I predicted 11 years. Here's hoping for a balloon-free 4th year of operation!
Since we are focusing on sustainability this year I thought it might be interesting to get some perspective. What's happening with renewable energy worldwide? Here's a plot.
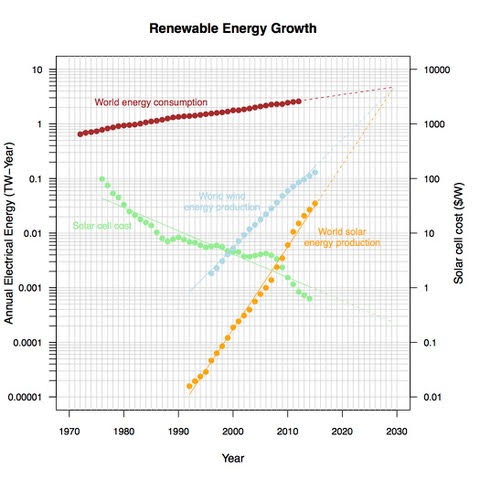
Let's start out with the orange data points. These represent the annual amount of electrical energy generated by solar worldwide [3].
I fit a solid orange line to the data. That may strike you as pretty boring. If so, you need to take a closer look at the left axis of the plot. It's not normal. The vertical axes on this plot are logarithmic. What that means is that solar is not growing by an additive amount every year but by a multiplicative amount every year. A straight line on a semi-log plot indicates exponential growth. That's not boring! In fact that straight line shows solar doubling every two years. If that sounds familiar it is the same rate of growth of computer memory density a growth rate known as Moore's Law.
To get exponential growth you need a feedback mechanism. An example of such a mechanism is illustrated by the green dots, the right vertical axis and the associated fit. Those green dots represent the cost of solar cells [4]. As the amount of solar energy has increased the cost of solar has decreased. This relationship is called Swanson's Law which states that when the cumulative shipped solar capacity doubles the price drops by 20%. BTW Richard Swanson is the founder of SunPower which made the solar cells for our array. It is economics, not increased efficiency, that is the driver of solar energy's exponential growth.
I've added wind energy production in light blue [5]. World wind energy production is "only" doubling once every 3 years.
Context is important. For that reason I've included the reddish-brown data points which represent the annual amount of electrical energy consumed by the world [6]. In 2012 the world consumed 2.6 TW-Year of energy. Apologies for the strange energy units. The reason I chose them is that you can easily divide by a year to get average power. In terms of energy consumption you can think of the world as a giant 2.6 TW light bulb. In 2012 solar contributed only 0.015 TW-Year or 0.6%. Wind contributed 3.2%.
You will notice that the slope of the orange and light blue curves are much steeper than the slope of the reddish-brown curve. Renewable energy production is growing much faster than world energy consumption. Since the data are so well fit by straight lines it is natural to think about extending them. That's what the dashed lines represent. They all meet (somewhat bizarrely) in 2029, 13 years from now. Those dashed curves are simple mathematical extrapolations of data. They assume that the future will be exactly the same as the past. So whether you should believe the extrapolations hinges on whether you believe the future will resemble the past. Should you believe the extrapolations?
a) YES - There is no shortage of sunshine. More solar energy falls on the Earth in a year than has been used by humanity in its entire history.
b) YES - There is no shortage of raw materials for solar panels and windmills [7].
c) YES - Economic power law relations have gone on for decades. Moore's Law has held up for 40 years!
d) YES - Several recent analyses have shown that unsubsidized solar, and even more so wind, are cheaper than fossil fuels [8]. So even if rebates and incentives disappear these trends will probably continue.
e) NO - As the amount of renewable energy production approaches world consumption it is obviously going to break from a straight line. We don't need to produce more energy than we consume! Or maybe we do, see below. How all of the renewable energy curves might bend to meet world demand is being studied. One scenario [7] has a 100% renewable power world (actually all energy, not just electrical) with the following mix wind 50%, solar 40%, geothermal 4%, hydro 4%, wave 1% and tidal 1%. Interestingly the authors project we could be there by 2030.
f) NO - Regardless of how much energy wind, water and solar could produce on average they simply cannot power the world until we solve the problem of the intermittent nature of these sources. While not solved, the outlines of a solution include [9],
(i) using complementary (wind and solar for instance) and non-variable renewable sources (geothermal and hydro for instance)
(ii) installing on-site battery storage
(iii) utilizing distributed battery storage (EVs for instance)
(iv) interconnecting widely dispersed generators (to reduce fluctuations)
(v) oversizing capacity
(vi) shifting flexible loads to better match generation
(vii) forecasting energy production as accurately as possible
I find this problem challenging and these solutions interesting to think about. I hope some of you (especially students) feel the same way. We need this problem solved or we will never be able to power the world with renewables.
So for the last two reasons I don't think you should believe my simple-minded extrapolations. But for the first four reasons I believe a world powered largely by renewable energy is closer than most people think.