Today is the 2nd anniversary of Occidental's 1 MW solar array. In the last year the array produced 1.86 GWh of electrical energy, slightly up (+2.8%) from our total 1.81 GWh last year for a grand total of 3.67 GWh.
Good Afternoon Occidental!
Today is the 2nd anniversary of Occidental's 1 MW solar array.
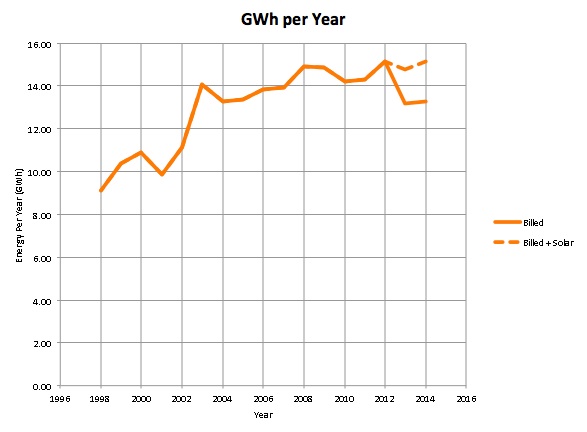
In the last year the array produced 1.86 GWh of electrical energy, slightly up (+2.8%) from our total 1.81 GWh last year for a grand total of 3.67 GWh. That is a LOT of energy. The average LADWP home uses 14.8 kWh per day so the energy produced by our array last year was enough to power 339 of our neighbor's houses for two years. For other equivalencies, especially regarding climate change, you can punch in 3.67 GWh = 3670000 kWh here. For instance, 3.67 GWh of green electricity, is equivalent to not driving an average passenger vehicle a little more than 6 million (!) miles. 3.67 GWh was 12.3% of the total electrical energy used by the college over the last two years. Here is the college's energy use over the past 17 years, by calendar year. The dashed line represents where we would have been without the solar array.
On the financial side of things, our electrical bills have been lower these last two years due to the energy generated by the solar array. Over the last year the solar array saved the college $282k, up from $241k last year, an eye-popping 17% increase in savings. What's going on here? Average electricity costs have been going up, on average 6.2% per year for the last decade, and last year was no different. The remaining 11% is due to solar savings on something called the Facilities Demand Charge which kicks in only after the array has been working awhile. If you are interested in the details you can follow this * to a long footnote below. All told then we have saved a cool $0.523M on a purchase price of $3.423M. We are 14% of the way to paying off the array. At an assumed 6% annual rate increase we will have paid** off the array 9 years from now, earlier than originally predicted.
If you want to monitor the array yourself you can log into our solar website,
Login ID = oxysolar
Password = 1600solar
An app can be found, for the iPhone, at the Apple's App Store by searching for AlsoEnergy.
Until the next anniversary I will leave you with this timely quote, "We are like tenant farmers chopping down the fence around our house for fuel when we should be using Nature's inexhaustible sources of energy — sun, wind and tide. ... I'd put my money on the sun and solar energy. What a source of power! I hope we don't have to wait until oil and coal run out before we tackle that." - Thomas Edison (1931)
Footnotes -
* Just like at your house the college gets charged for the energy (measured in kWh) we use. Last month, for instance, we were charged 12.18 cents per kWh. We used 928,637 kWh last month so our energy charge was about $113k. But since the college is so large LADWP, like other utilities, slap on what they call a demand charge. The demand charge is calculated this way. On a 15 minute basis the LADWP monitors the rate at which we use energy, which in utility-land this is called demand, everyone else calls this power. They take our maximum demand over the month and multiply it by a fixed $ per kW. Last month we maxed out at 2,070.4 kW and the demand charge was $4.30 per kW so we owed them an additional $8.9k. Why? In utility-land the argument is that more or bigger power spikes mean that utility would have to purchase more, or bigger, power plants to meet the demand. If you find this argument hard to follow, join the crowd. That's the monthly demand charge, but it gets better. The LADWP also levies a Facilities Demand Charge which is based on the maximum demand over the year. We always peg our power meter in the middle of September when the students come back. For the remainder of the year we pay for that power spike. Last September we spiked at 2,899.80 kW and the rate is $6.68 so we have to pay an additional $19,370.66 per month because of this charge! Altogether our demand charges account for about 30% of our electrical budget. The solar array helps with our demand because if the power spike for the month, or the year, occurs when the solar array is generating power it lowers our demand. For the first year of operation we had to wait until September to see any solar savings from the Facilities Demand Charge. This makes up the additional 11% discussed above.
** When I calculate a payback period I assume that all of the money for the solar array came from the endowment and that all savings immediately go back into the endowment which grows at 8%.